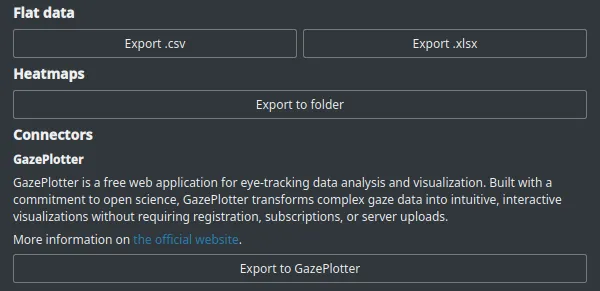
Finally, data can be exported from Tacty in three major ways: as flat data, as heatmaps, or through connectors to other services.
Flat data
Section titled “Flat data”When exporting flat data, each finger gets the following columns:
x- x coordinate of the finger in millimetersy- y coordinate of the finger in millimeters,- a column for each Area of Interest, containing 1 if the finger is inside the AOI and 0 if it is outside
Represented in a table, the columns look like this:
| time | finger1 | finger1 | finger1 | finger1 | finger1 | finger2 | finger2 | finger2 | … |
|---|---|---|---|---|---|---|---|---|---|
| x | y | aoi1 | aoi2 | … | x | y | aoi1 | … |
This data can be exported as a .csv or .xlsx file.
Heatmaps
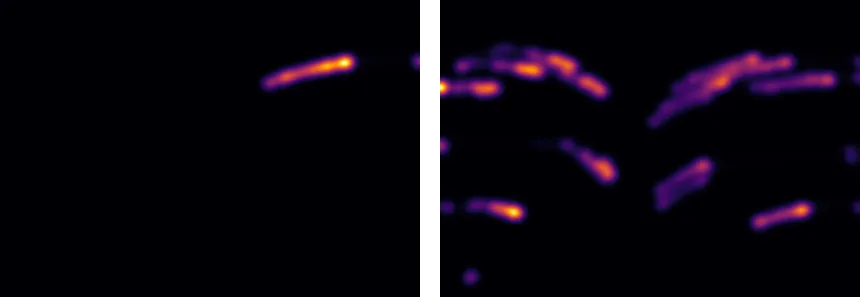
Section titled “Heatmaps”When exporting heatmaps you will be asked to select a folder. Inside, Tacty will generate a .png heatmap for each finger, as well as a combined one.
The following is an example heatmap of a single finger, as well as a combined heatmap of all fingers:
Connectors
Section titled “Connectors”Connectors export data in custom formats, as required by other services.
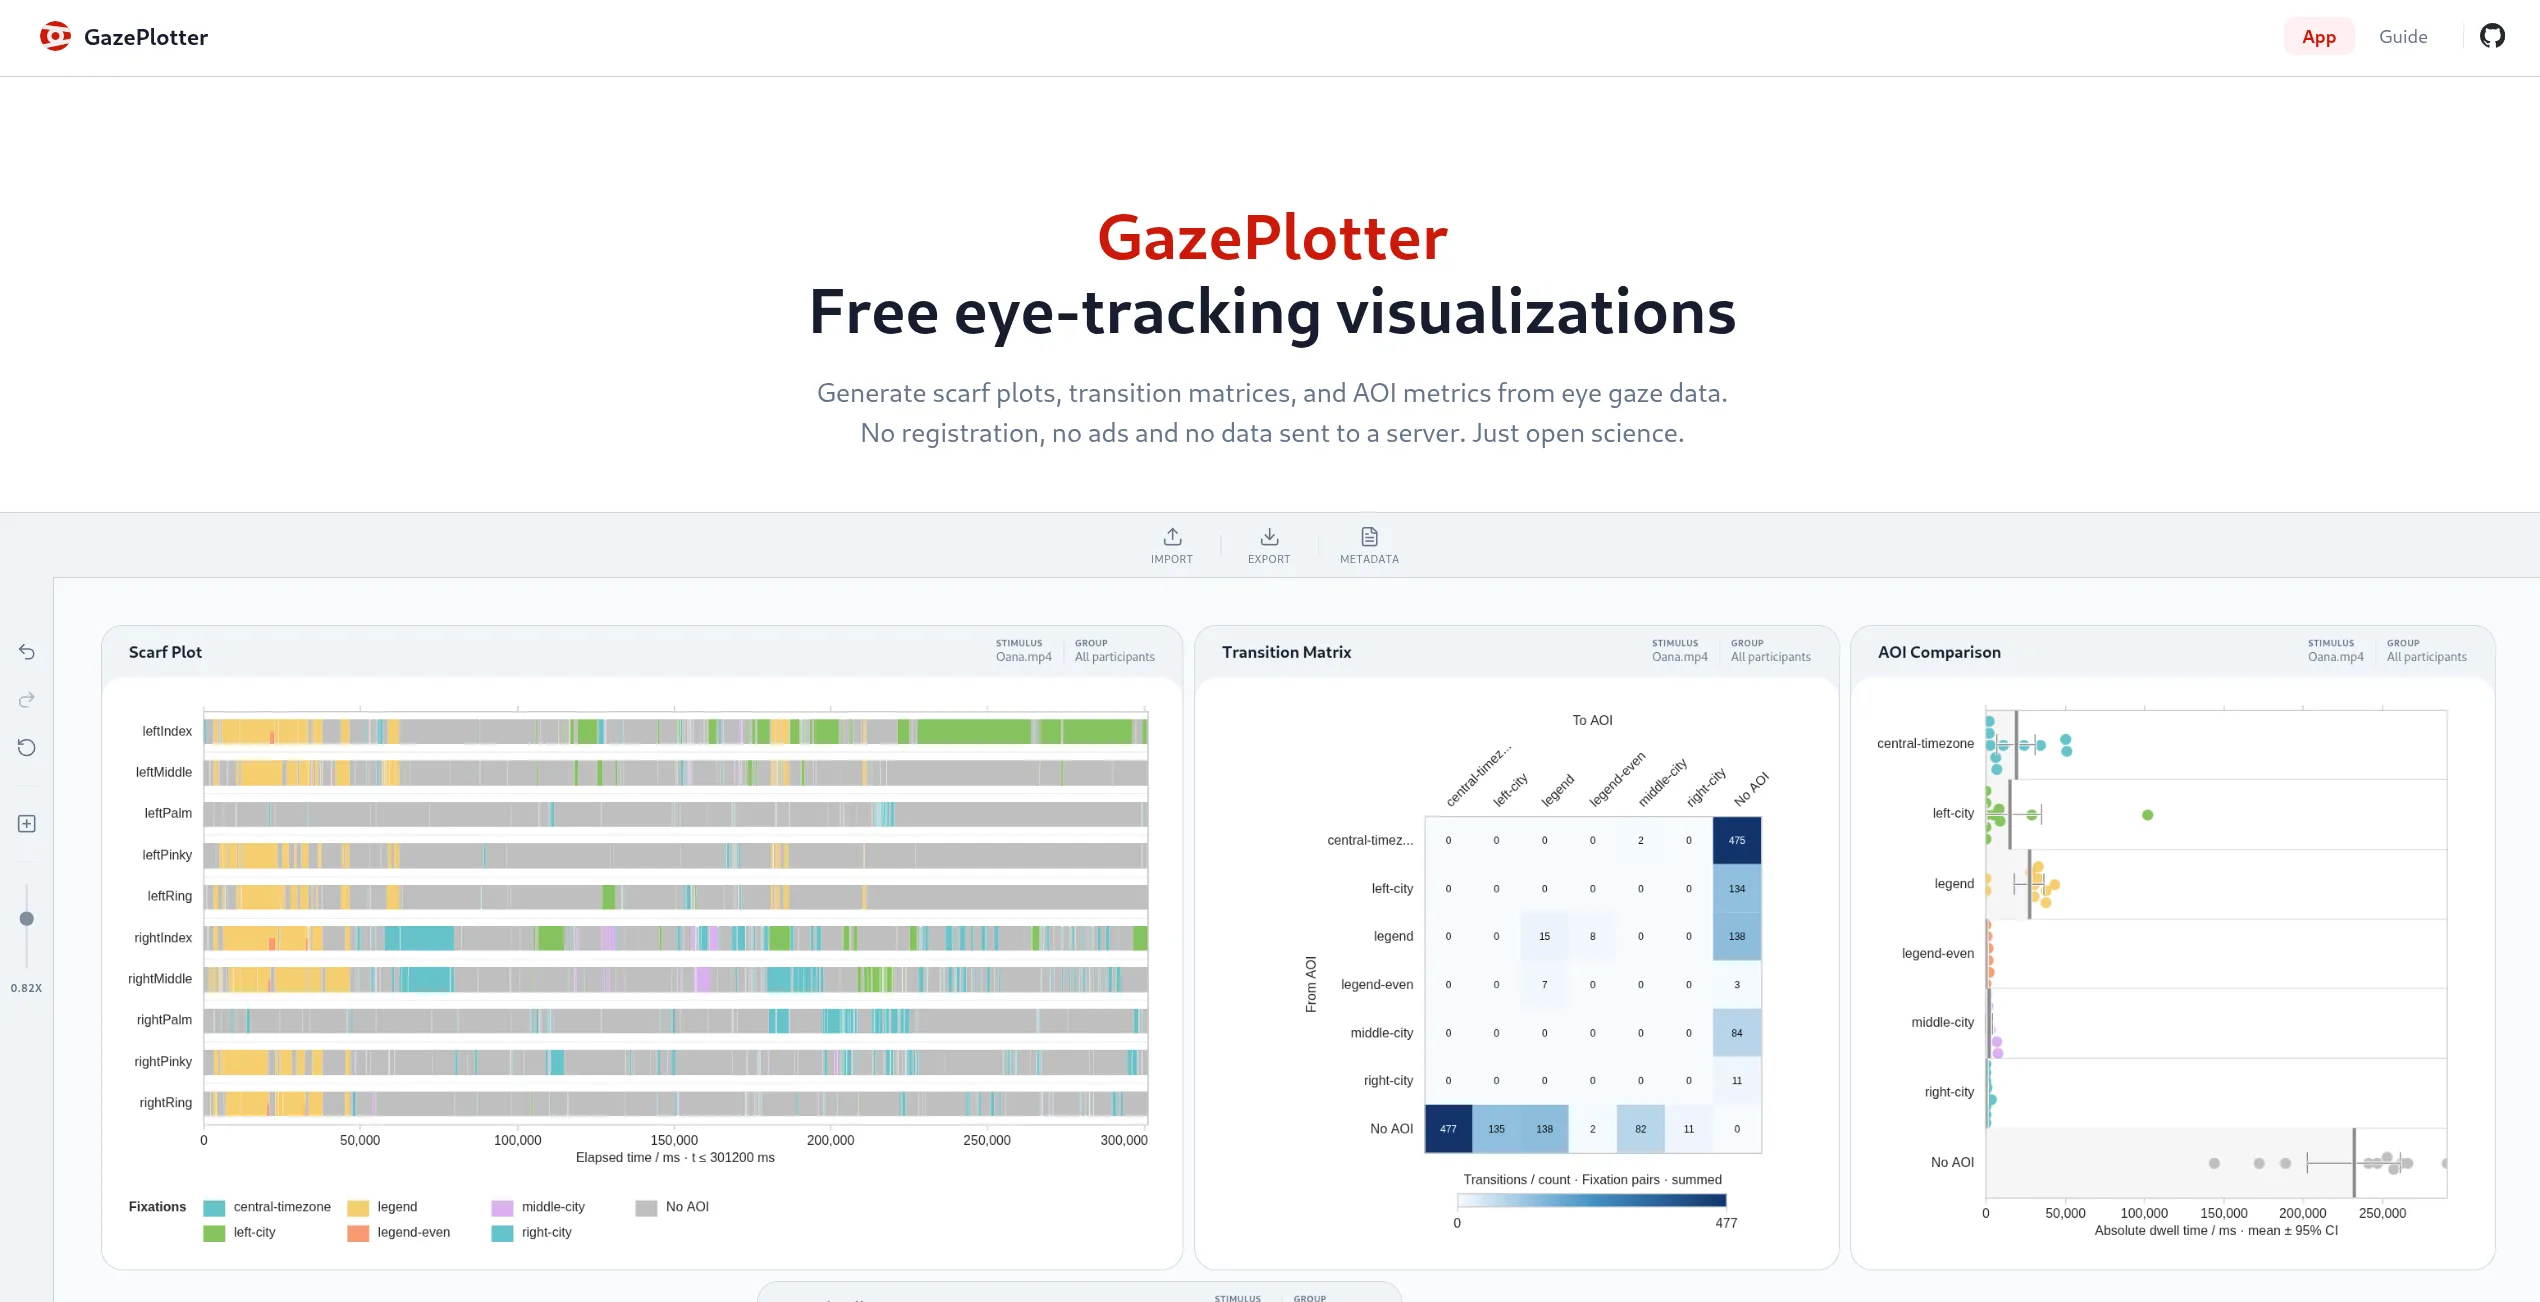
GazePlotter
Section titled “GazePlotter”GazePlotter is a free web application for eye-tracking data analysis and visualization. Built with a commitment to open science, GazePlotter transforms complex gaze data into intuitive, interactive visualizations without requiring registration, subscriptions, or server uploads.
When exporting to GazePlotter, Tacty will generate a .csv file following the format described in their Custom CSV documentation. Each finger will be represented as a separate participant. You can then easily use the GazePlotter interface to create groups such as “left hand” and “right hand”.